
IBM GENERATIVE ART / AEM MIGRATION
A system that turns data into art — at scale
CLIENT – IBM
PROJECT – Generative Art Leadspace Component
ROLE – Creative Lead
CHALLENGE
Thousands of IBM product pages (older “foundation” products) were slated for automated migration without design resource allocation. Our migration team needed a unified visual solution for the leadspaces that communicated the unique attributes of each product, reinforced the brand, and could be automated at scale. Historically, generic and interchangeable stock photographs of “people using devices” was the default, which was not an acceptable option for us.
CONSIDERATIONS
Ease of use: The solution would be implemented in AEM with minimal budget, limited design time, and little input from the product team.
Outdated product UI: Not all of IBM’s software products had been “Carbonized,” or designed in the Carbon Design System. Designers and strategists were hesitant to show outdated products that were aesthetically unappealing and clashed with the Carbon design on the rest of the page.
A modern solution: Generative art made sense for IBM, a forward-thinking tech company already embracing AI with its watsonx products. IBM had used generative art previously in Think 2020 branding.
GOAL
Our goal was to leverage existing systems – IBM’s extensive design language, including a pictogram library, grid system and broad color palette and the existing product taxonomy – to create a solution rooted in data, with concrete meaning.
DATA MAPPING
Every IBM software product had an ID code (EDG ID) that assigns its product type, lever and category within the digital catalog. This allowed us the control to include consistent visual elements between, for instance, all security software products.
TILE ASSET LIBRARIES
We built a collection of graphics libraries for each data dimension. Each tile had to be pixel-perfect to properly align with the others at multiple breakpoints on a dot grid.
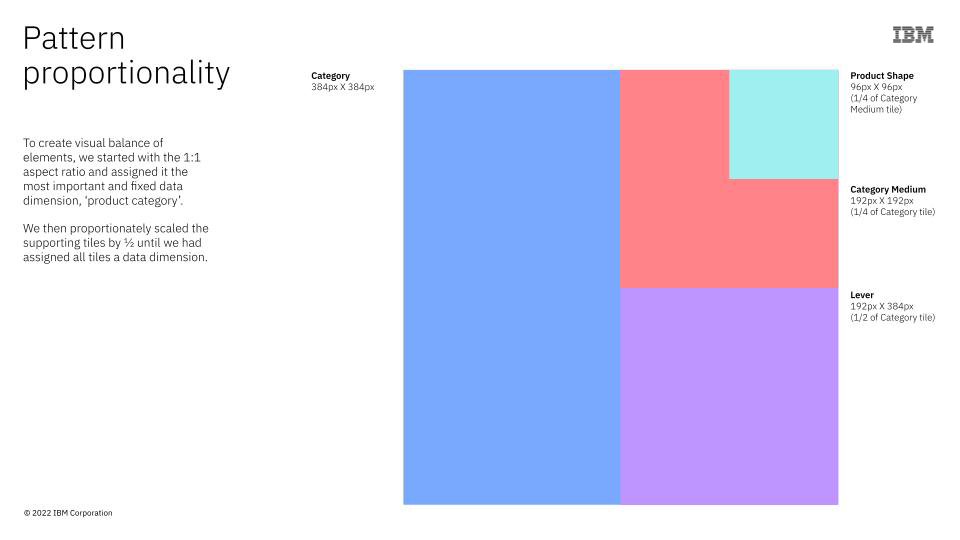
COMPOSITION
We determined a set of pattern variations that established visual hierarchy through size and position of the tiles. To create a visual balance of tiles, we started with a 1:1 aspect ratio and assigned it the most important and fixed data dimension, ‘product category’. We then proportionately scaled the supporting tiles by ½ until we had assigned all tiles a data dimension.
RANDOMIZATION
Pattern, exact tile graphic for each dimension, and color palette were randomly assigned through an algorithm.
TESTING
Since we had millions of options with the variations above, testing proved unwieldy. We eventually reduced the patterns and points of interacting graphics for more control over the final compositions.
DEVELOPMENT
The final stage of development can be a bottleneck for innovative projects. We actively involved stakeholders early in the process. Their input, as well as positive feedback from design leadership who championed the work, led to prioritized development in AEM.
OUTCOME
We presented this initiative across multiple IBM teams and it was adopted as an innovation model.


Demonstration of the "proof of concept” for the generative leadspace art widget.